

Growing a social media page today requires more than posting good content. You need precision, clarity, and analytics deep enough to explain why something performs, not just what performed. AnalyticsHunter was created exactly for this purpose.
This platform offers the most advanced and detailed social media analytics available anywhere. While other tools only show basic numbers, AnalyticsHunter provides full-scale performance intelligence with high-resolution dashboards, engagement breakdowns, eCommerce-linked insights, post-level tracking, hourly audience activity data, and growth charts that do not exist on competing services.
Whether you are a creator, a brand, or an agency managing many accounts, AnalyticsHunter gives you a complete understanding of your audience and your content. Every chart and every metric is designed to help you scale your pages faster and make confident decisions.
From what you post to how your audience behaves, every detail is visualized with unmatched accuracy.
For eCommerce brands, the tool becomes even more powerful. You can connect your online store, match your posts directly with products, and track which items drive views, engagement, and reach. This creates a complete performance dashboard for anyone selling through social platforms.
Key features include:
- Post-specific analytics that show views, likes, saves, shares, reach, watch time, and conversion ratios
- Deep audience activity mapping that reveals when your followers are online hour by hour
- Growth graphs that display follower trends, engagement momentum, and overall account movement
- Multi-account comparisons for creators, brands, and agencies
- Store integration that allows product-post pairing for real-world sales insights
- Unique visual charts available only on AnalyticsHunter
AnalyticsHunter is built for people who want to grow quickly, understand what works, and turn insights into real results. It is more than an analytics tool. It is a complete command center for scaling your social media presence.
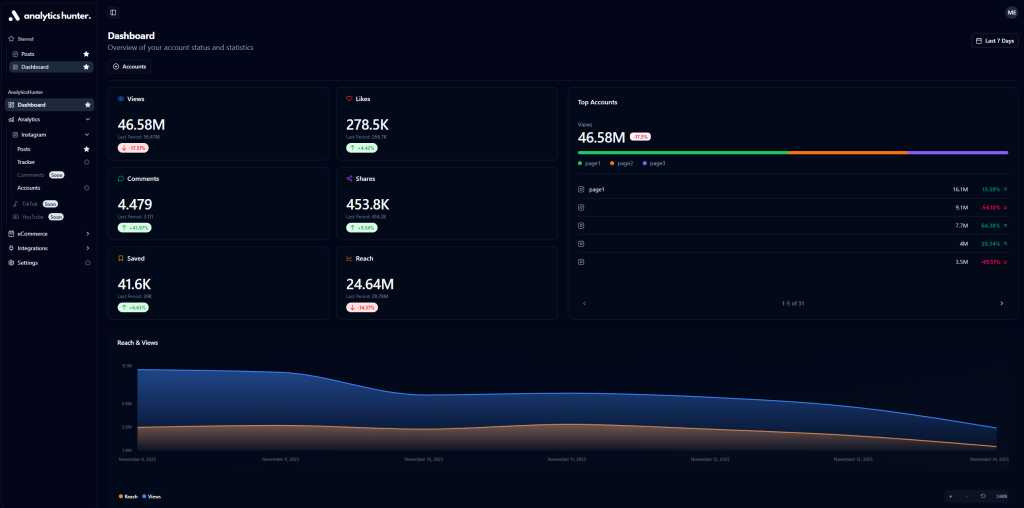
Dashboard: A Complete Overview of Your Social Media Performance
The Dashboard is the central command panel of AnalyticsHunter. It brings all essential metrics into one clean and powerful view, allowing you to understand overall performance within seconds. Every number updates in real time and each card provides instant context by showing how your results compare to the previous period.
The top section highlights your core engagement metrics. You can immediately see total views, likes, comments, shares, saves, and reach across all connected accounts. The cards display clear percentage changes, so you can quickly identify growth or decline and understand how your content is trending week by week.
On the right side, the Top Accounts panel shows which of your pages are performing the best. Each account is visualized with a colored bar and real numbers that display total views and period comparison. This makes it incredibly easy for creators, brands, and agencies to track multiple pages at once and see which ones are gaining momentum.
The lower part of the Dashboard presents a detailed Reach and Views graph. This area chart illustrates your performance over time, allowing you to spot patterns, drops, and spikes across specific dates. It helps you understand how posting frequency, content types, and external factors influence overall traffic.
Together, these elements create a complete snapshot of your growth. The Dashboard is designed for speed, clarity, and accuracy, giving you immediate insight into what is working and what needs attention.
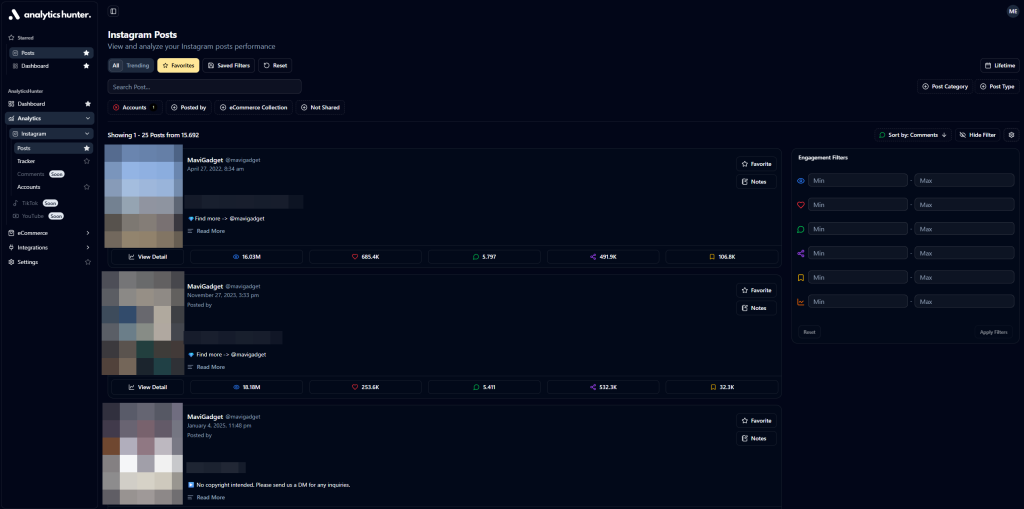
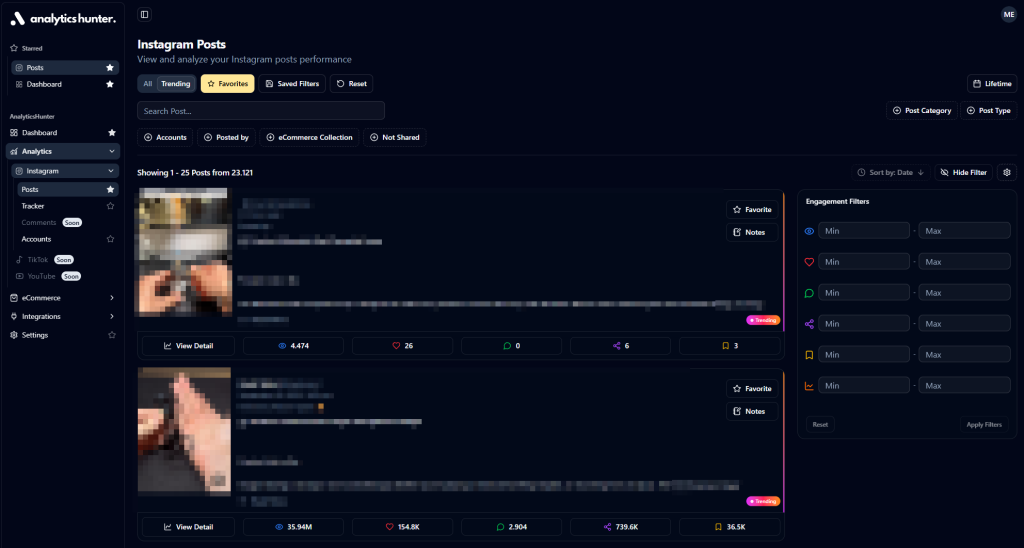
Trending Posts: Track What Is Going Viral in Real Time
The Trending section inside AnalyticsHunter gives you instant visibility into the posts that are gaining momentum across your Instagram accounts. This area is designed for creators and brands who want to understand which content styles, topics, or products are currently performing above average.
Every post in the list is updated automatically and ranked based on real engagement signals. You can see views, likes, comments, shares, saves, and reach from a single streamlined view. The interface highlights performance spikes, making it easy to identify posts that are spreading quickly.
The Trending filter is especially valuable for pages that rely on viral traffic. You can open any post to view its detailed analytics, understand what triggered the engagement spike, and replicate the content format or concept for future growth. It is also a powerful way to monitor your team or multiple page managers, since each post clearly displays who uploaded it and which product it is linked to.
On the right side, engagement filters allow you to search through thousands of posts by setting minimum and maximum thresholds for all engagement types. This helps you isolate high performers, compare them with recent uploads, and make data-driven decisions on what to post next.
Whether you manage a single brand or dozens of accounts, the Trending section becomes your real-time radar for viral opportunities. It keeps you ahead of the curve and ensures that you never miss a post that has the potential to explode.
Conclusion: The New Standard for Social Media Analytics
AnalyticsHunter is built for a world where creators, brands, and eCommerce businesses grow through data. Instead of guessing what works, this platform gives you full clarity. Every post, every trend, every audience movement, and every product connection becomes measurable and understandable.
With features that combine advanced analytics, store integration, real-time trending insights, and detailed audience tracking, AnalyticsHunter sets a new standard in the analytics industry. It gives you the tools to make smarter decisions, move faster, and grow with confidence.
For anyone who wants to take social media performance seriously, AnalyticsHunter is not just helpful. It is essential. It replaces uncertainty with strategy and transforms raw data into practical actions.
This is where growth begins.
This is where real insight becomes real results.